pgwd landed on awesome-postgres
Yesterday was a quiet kind of good news. pgwd is now on awesome-postgres — the curated list of PostgreSQL software that a lot of us open when we are hunting for tools, not marketing pages.
It sits in Monitoring, next to exporters, Nagios checks, dashboards, and the other watchdogs people actually run. The merged pull request is #532 (31 August 2026). The blurb they accepted is the one I wanted: no superlatives, just the job:
pgwd — monitors PostgreSQL connection usage and stale sessions, with threshold alerts, Prometheus metrics, and multiple notification backends.
That is the whole product in one sentence. Connection counts (total, active, idle, stale), optional long-query alerts, hysteresis so you are not paged in a flapping loop, and notifications through Slack, Loki, PagerDuty, Teams, or a generic webhook. A small Go CLI. Config in YAML. Optional SQLite or SQL metrics store. Helm and Compose live in pgwd-selfhosted.
Why this one made me smile
I have not written here since the GROOT 1.0 note in July. Most of the hours went into shipping: releases, ports, image scans, the boring work that makes a tool safe to leave running. Lists like awesome-postgres are not a trophy. They are a map. Someone looking for “how do I notice when Postgres is out of connections” can now trip over pgwd the same way I trip over postgres_exporter or pgmetrics.
Thank you to the awesome-postgres maintainers for reviewing and merging, and to everyone who has starred, packaged, or filed an issue on pgwd. If you already run it, you did not need a list to find it. If you do not, the list is a fair place to start.
gghstats baseline (frozen)
GitHub only keeps traffic for 14 days. I run gghstats so the series does not fall off the cliff. Same-day as this note I exported the hrodrig/pgwd chart JSON and I am leaving it here as a baseline, not as a victory lap.
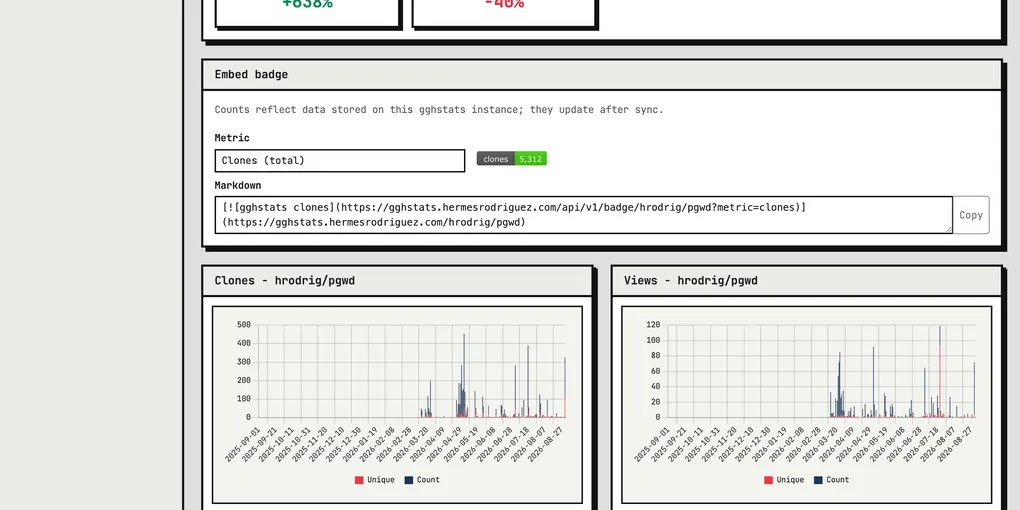
Live dashboard: gghstats.hermesrodriguez.com/hrodrig/pgwd. Same morning I captured the English UI (cards, 7d/30d momentum, clones/views/stars charts) so the spike is visible without opening the JSON — that capture is the image at the top of this note.
The screenshot is the live page, locale EN, 1 September 2026. The numbers on the cards are dashboard totals (history in SQLite), not the 30-day JSON slice below. Frozen file: gghstats-hrodrig-pgwd-traffic-20260901.json (fetched_at 2026-09-01T10:36:23Z, dense=1, window 2026-08-03 → 2026-09-01). 1 September is incomplete (count/uniques are null). Latest completed UTC day in the snapshot: 31 August.
| Slice (clones / views) | Event count | Unique |
|---|---|---|
| 28 days before the merge (3–30 Aug) | 256 / 41 | — (uniques are per day; do not add them) |
| Merge day, 31 Aug 2026 | 327 / 72 | 113 / 5 |
| 30-day window as stored (excl. 1 Sep) | 583 / 113 | — |
The quiet days in that window are mostly single-digit clones. There was already one bump on 10 August (97 clones, 19 unique). 31 August is a different shape: 327 clones and 113 unique cloners, plus 72 views.
I will not pretend every clone is “because awesome-postgres.” The PR, GitHub notifications, the list itself, and whatever else people clicked that Monday all land in the same daily bucket. The point of freezing the file is so a later export can be compared against this window instead of against GitHub’s 14-day amnesia.
Links
- List: awesome-postgres → Monitoring
- PR: dhamaniasad/awesome-postgres#532
- Product: github.com/hrodrig/pgwd · pgwd.hermesrodriguez.com
- Install:
curl -fsSL https://get.pgwd.hermesrodriguez.com/install.sh | sh - Operator deploy: pgwd-selfhosted
- Traffic baseline: gghstats / hrodrig/pgwd · JSON snapshot 2026-09-01
If the listing helps one operator catch a too many clients night before the app does, that is enough joy for me.